Claude Code on Google Cloud: org spend limits and ROI
TL;DR
- Usage through Google Cloud does not appear in Anthropic's analytics dashboard or the Claude Code Analytics API, so you collect costs yourself
- Google Cloud spend caps apply per project and service. When a cap is hit, all Agent Platform use in that project stops
- Per-developer limits can be set by day, week, or month with Claude apps gateway, which you run yourself
- Anthropic's example impact metrics are PR cycle time, rework, and volume. The PR count Claude Code reports is PRs created, not PRs merged
Contents (8)
- Through Google Cloud, Anthropic’s reporting is not available
- Split spend limits between Google Cloud budgets and per-developer limits
- On Google Cloud, limits are per project and service
- Per-developer limits come from Claude apps gateway
- Don’t over-restrict expensive sessions
- Collect usage by person, department, and model with OpenTelemetry
- What impact metrics count, and what to compare them against
- Three things to decide first
The article on Claude Code cost management I wrote in September was about a developer checking their own /usage and adjusting consumption with effort. Once an organization rolls out Claude Code, administrators face different questions: who is spending how much, where to stop overspending, and how to explain what the money bought.
On October 27, Anthropic published an article that splits these three into “Control,” “Track,” and “Prove.” It targets organizations using Claude through Google Cloud, and is based on a webinar held jointly with Google Cloud. In this article I check the features it mentions against the official documentation, and sort out the units limits apply to and how things stop.
Through Google Cloud, Anthropic’s reporting is not available
Where you see costs depends on how you buy. The official documentation breaks it down by channel as follows.
| Channel | Where to see costs | Where to set limits | Per-user breakdown |
|---|---|---|---|
| Claude for Teams / Enterprise | Cost report in the organization’s analytics dashboard | Spend limits in the admin console | Cost report CSV (Enterprise also has the Analytics API) |
| Claude Console (API) | Console usage page | Workspace spend limits | Console dashboard, Claude Code Analytics API |
| Amazon Bedrock, Google Cloud Agent Platform, Microsoft Foundry | Each cloud’s billing pages | Each cloud’s budget features | OpenTelemetry or an LLM gateway |
Through Google Cloud’s Agent Platform (formerly Vertex AI), per-token charges appear on your Google Cloud bill. Claude Code does not send cloud-side usage numbers to Anthropic. As a result, this usage does not show up in Anthropic’s analytics dashboard or the Claude Code Analytics API. You have to collect per-user numbers yourself.
Split spend limits between Google Cloud budgets and per-developer limits
Both Google Cloud and Claude Code have features for setting limits. They work at different units, so you give them different roles.
On Google Cloud, limits are per project and service
The article lists these Google Cloud features:
- Project isolation: create a project just for Claude Code to separate its costs
- Budgets and alerts: get notified when actual spend crosses a threshold
- Spend caps (Preview): enforce a budget per service
- Export to BigQuery: analyze Claude costs alongside your other cloud costs
- Quotas: per model and endpoint location, there are limits on requests, input tokens, and output tokens per minute
- Provisioned Throughput: reserve capacity at a fixed price instead of paying per use
Of these, a spend cap stops all Agent Platform use in the project at once when it is reached. According to Google Cloud’s documentation, a cap applies to one service within one project, and the only period is monthly, starting on the 1st. Agent Platform (aiplatform.googleapis.com) is among the supported services.
Emails go out when spend crosses 50%, 80%, and 100% of the budget. Past 100%, new use of that service in that project is blocked until the end of the period. Everyone using Agent Platform in that project is stopped. You can lift the cap manually, but after lifting it, it can take up to 1 hour for service to come back.
The amount is judged on estimated list-price cost, excluding discounts and credits. The check is faster than billing reports but not instant, and overage is billed as usual. So spend caps appear to be meant for stopping organization-wide overspending, not for managing individual developers.
Per-developer limits come from Claude apps gateway
What sets limits per developer is Claude apps gateway. It ships in the same claude binary developers already use; you run it in your own Google Cloud project and place it between Claude Code and Agent Platform. Developers sign in with your identity provider, such as Google Workspace, so every request is attributed to a person.
By default, the gateway forwards all inference through one shared upstream credential, so Google Cloud billing attributes everything to that credential, not to individual developers. The documentation gives the example of a runaway swarm of agents draining the organization’s budget, and positions gateway limits as a “per-developer circuit breaker” on top of shared billing.
Limits can be set at three scopes (user, identity provider group, and organization) over daily, weekly, or monthly periods. You configure them through the admin API, not in gateway.yaml. Here is an example that sets $500 per developer per month across the organization (the amount is a string in cents).
curl -sS https://claude-gateway.internal.example.com/v1/organizations/spend_limits \
  -H "x-api-key: $GATEWAY_ADMIN_WRITE_KEY" \
  -H "Content-Type: application/json" \
  -d '{"scope": {"type": "organization"}, "amount": "50000", "period": "monthly"}'
Source: Claude apps gateway spend limits (Claude Code docs)
Four behaviors are worth knowing before you configure it:
- Group and organization limits are not a shared pool split among members. They are defaults applied to each person. A person’s limit is decided in this order: their own individual setting, the strictest limit among their groups, then the organization default
- Once a limit is exceeded, the next request gets a
429, and requests stay blocked until the period rolls over or an administrator raises the limit. Periods roll over at 00:00 UTC, so a daily limit resets at 9:00 every day Japan time - Claude Code warns the developer when usage crosses 75% and 95%. Google Cloud budget alerts go to administrators; these appear on the developer’s screen
- The amounts the gateway counts are list-price estimates. For billed amounts, reconcile against Google Cloud usage reports
The gateway can also restrict which models each identity provider group can use and set a default model. Anthropic says setting a default model worked very well: most people stay on the default, and those who switch have a reason. Note that Google Workspace tokens do not carry group information. To split by group, you need the gateway’s oidc.google_groups setting (deployment steps for Google Cloud).
Don’t over-restrict expensive sessions
On limits, the article stresses steering over restricting. It says expensive sessions often belong to people trying new ways of working, and are often high-value too. According to the article, waste tends to show up in the tier below them, the “heavy users.” Its two examples are using a top model for daily routine work that Sonnet could handle, and forgetting to turn off scheduled runs that are no longer needed.
It also shows an example of connecting the gateway’s admin API to a ticketing system so people who hit their limit can request an increase.
Collect usage by person, department, and model with OpenTelemetry
The main way to see Google Cloud usage per user is Claude Code’s OpenTelemetry output. According to the monitoring documentation, it is enabled with CLAUDE_CODE_ENABLE_TELEMETRY=1 and can be sent over OTLP to your own monitoring stack.
The main metrics are sessions, lines of code changed, PRs created, commits, cost, tokens, and active time. Cost metrics carry attributes for model and effort, as well as which subagent, skill, plugin, or MCP server the usage came from, so you can also see how much your in-house skills are used. However, the names of agents and MCP servers you built yourself, and of plugins from unofficial marketplaces, are replaced by default with custom or third-party; to emit the real names you need OTEL_LOG_TOOL_DETAILS=1.
To aggregate by department or cost center, put attributes in OTEL_RESOURCE_ATTRIBUTES.
export OTEL_RESOURCE_ATTRIBUTES="department=engineering,team.id=platform,cost_center=eng-123"Source: Monitoring (Claude Code docs)
With the gateway, you don’t need to configure each developer’s machine. When you set an export destination on the gateway, output is enabled for signed-in developers and arrives tagged with their sign-in email address and groups.
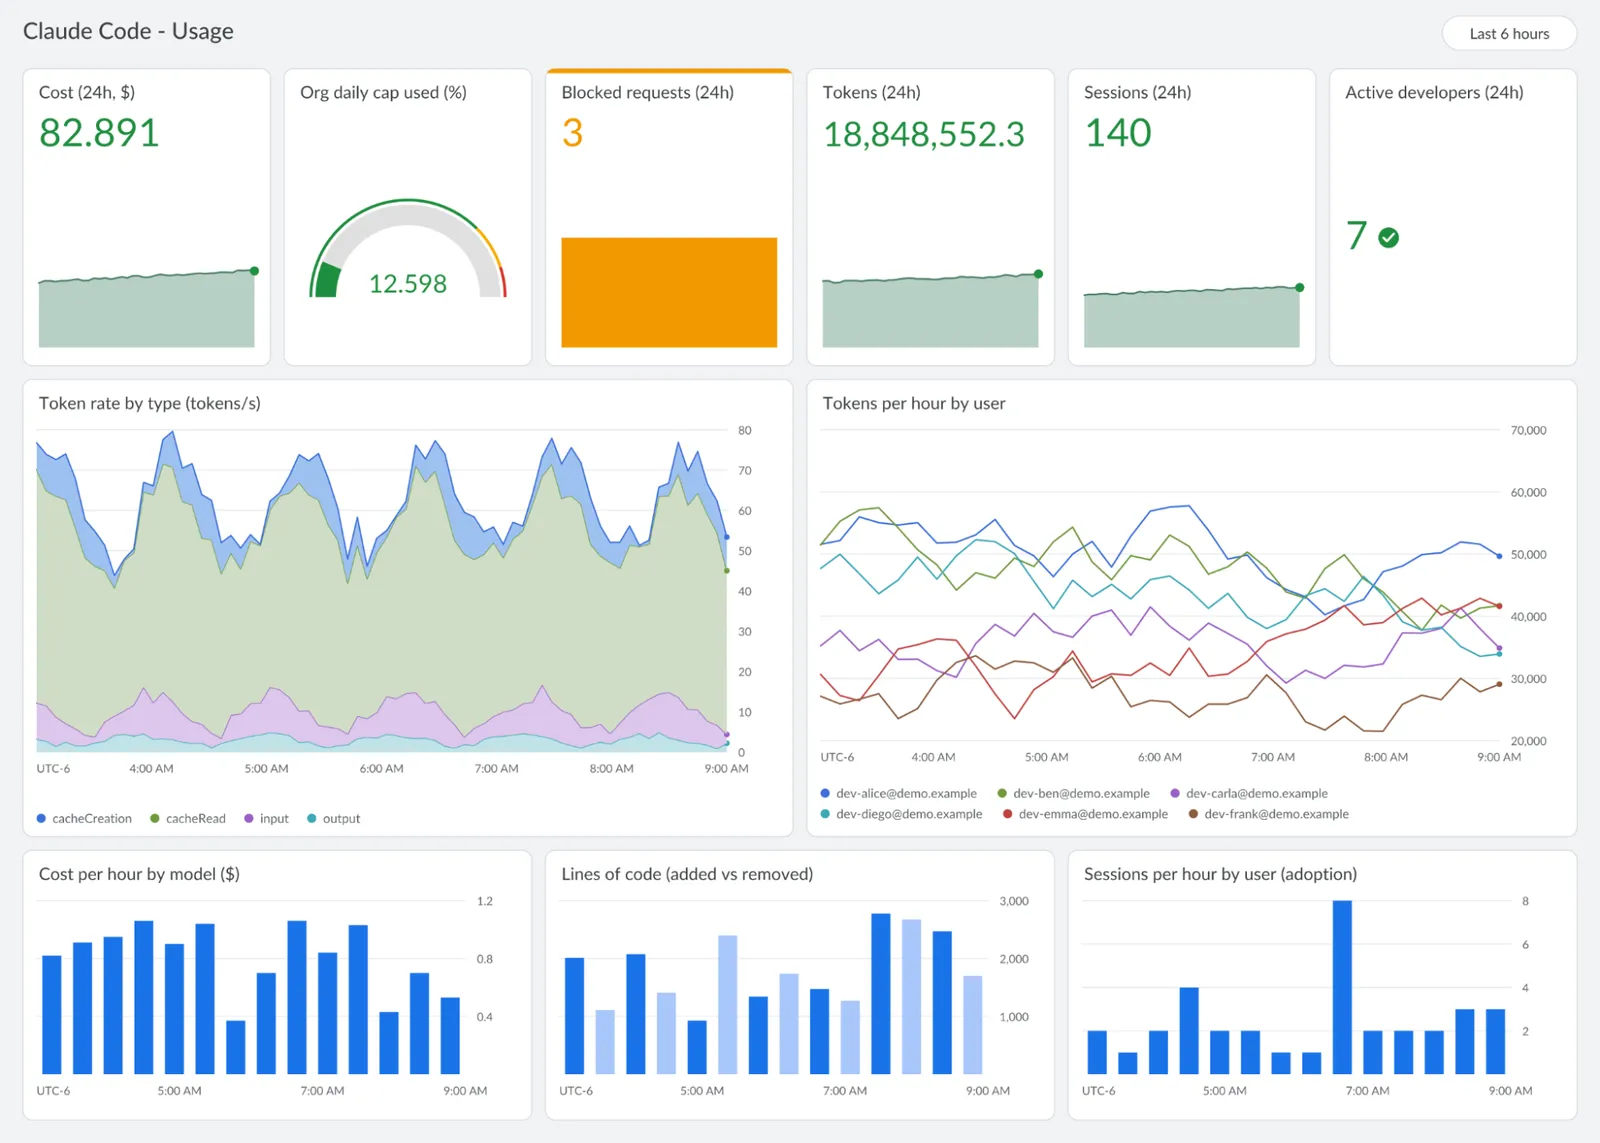
“Blocked requests” on the screen is the number of requests stopped by gateway limits.
You can load the Claude Code Monitoring dashboard that Google Cloud publishes straight into Cloud Monitoring. It puts sessions, users, commits and PRs, edit acceptance rate, and estimated tokens and cost per user and model on one screen. The README lists two common pitfalls:
- Per-user aggregation groups by the
user.emailattribute. It is added automatically if you sign in through the gateway or a Claude account, but not when calling Agent Platform directly, so you write it per person inOTEL_RESOURCE_ATTRIBUTES - Leave the metric export interval (
OTEL_METRIC_EXPORT_INTERVAL) at the default 60000 milliseconds, and don’t set it below 15000 milliseconds. Cloud Monitoring rejects points that arrive for the same series within about 15 seconds of each other, and the error only saysBad Request, so missing data is easy to overlook
Prompt text can contain confidential information, so it is not logged by default. If you want to know what Claude Code is used for, enable it explicitly with OTEL_LOG_USER_PROMPTS=1. Whether to enable it likely needs to be decided in line with your organization’s information-handling rules.
What impact metrics count, and what to compare them against
Anthropic splits impact metrics into three groups: “usage,” “satisfaction,” and “outcomes.” Usage comes from OpenTelemetry data, and satisfaction from short surveys before and after rollout plus follow-up interviews. Outcome metrics are compared against pre-rollout performance.
As a starting point for outcome metrics, it lists three dimensions.
| Dimension | Example metrics |
|---|---|
| Time | Time from opening a PR to merging it, time spent on code review |
| Effort | Review round-trips per PR, amount of review comments and rework |
| Volume | PRs per engineer, deployment frequency, concrete work completed with freed-up time |
According to the article, the baseline numbers to compare against already exist in your source control and ticket history. It also says these metrics are guidelines, not rules.
It gives two cautions about counting. The first is that a typo fix and a new feature each count as one PR. So it recommends counting only PRs of a defined type (ones Claude opened and a person decided to merge), and making them filterable later with labels or ticket numbers.
The second is that Claude Code’s PR metric is the number of PRs Claude Code created, not the number that were eventually merged. The record of what shipped lives in GitHub, GitLab, or your ticketing system. Some work, such as incident investigation or building demo data, never becomes a PR, so you end up reading Claude Code’s numbers alongside source control and ticket records.
Three things to decide first
The article recommends starting by setting three things at reasonable values: an organization-wide limit, a default model, and a list of allowed models. Once usage data builds up, adjust by role or team.
On Google Cloud, it also seems worth deciding up front whether to give Claude Code its own project. If you do, spend caps and budget alerts can apply to Claude Code alone. If it shares a project with other AI usage, hitting the cap also stops other systems that use Agent Platform.
Related notes
AI
Claude Code: low effort for subagents only, measured
Since v2.1.292, Claude Code can set effort each time it launches a subagent. I measured time and estimated cost with search subagents at low and with the docs' "time matters" line.
5 min
AI
Cutting Claude Code costs: watch /usage, tune effort levels
How to check token usage and estimated cost with Claude Code's /usage, and how to choose among effort levels (low to max), based on Anthropic's official documentation.
5 min
AI
Anthropic's role-based plugins: what they add to Claude Code
I read the 123 entries in knowledge-work-plugins, a role-based plugin catalog built for Cowork, then installed some in Claude Code to check always-on tokens and MCP connections.
6 min