Observability vs. monitoring, and the ID that links signals
TL;DR
- Observability is the property that lets you ask "why is this happening?" from the data a system emits, without knowing its internals. The term comes from control theory
- Logs record individual events, metrics record numbers aggregated over time, and traces record the path one request took. Metrics are cheap but lose detail; traces are detailed but expensive
- A trace ID links the three, and over HTTP it is passed to the callee in the W3C Trace Context traceparent header
Contents (9)
- It differs from monitoring in whether you can ask questions afterward
- Logs, metrics, and traces differ in the questions they answer and their cost
- Logs
- Metrics
- Traces
- Decide what to measure from the four golden signals
- A trace ID links the three
- Checking it on my own machine
- The biggest effort is instrumentation
Talks at study sessions use “observability” without explaining it, as in “once we added observability, we found the cause right away.” On November 2, Grafana Labs announced the general availability of Instrumentation Hub, which it says makes adopting observability easier. Yet talks tend to skip how observability differs from monitoring and why you collect all three of logs, metrics, and traces. In this article I check those points against official documentation and run the mechanism that links the three on my own machine.
It differs from monitoring in whether you can ask questions afterward
The OpenTelemetry observability primer describes observability as what “lets you understand a system from the outside by letting you ask questions about that system without knowing its inner workings.” It also mentions being able to investigate problems you did not anticipate (“unknown unknowns”) and to answer “why is this happening?”
The term comes from control theory. The CNCF Observability Whitepaper quotes the definition “a measure of how well internal states of a system can be inferred from knowledge of its external outputs.”
Monitoring overlaps with observability, but the two differ in when the questions get decided. The monitoring chapter of Google’s SRE book splits the questions monitoring should answer into two, “what’s broken” and “why,” calls the first the symptom and the second the cause, and gives the example of a symptom of serving HTTP 500s against a cause of the database refusing connections. Alerts fire on symptoms, and you investigate to find the cause.
Roughly, monitoring seems to be a mechanism that decides “what to watch” up front and notifies you when something deviates. Observability refers to a property of the system: after you get that notification, can you ask questions you did not decide in advance and track down the cause? That presumes the application emits enough data. The OpenTelemetry primer calls a system “properly instrumented” when developers do not need to add instrumentation (code that emits data) to troubleshoot an issue.
Logs, metrics, and traces differ in the questions they answer and their cost
OpenTelemetry calls the data a system emits signals and supports traces, metrics, logs, and Baggage (contextual information passed between signals). Profiles, which record resource usage at the code level, are in development or at the proposal stage. The first three are what people often call the “three pillars.”
| Signal | What it records | Questions it answers well | Cost profile |
|---|---|---|---|
| Logs | Individual timestamped events | What happened at that moment | Keeps individual events, so processing costs more than metrics |
| Metrics | Numbers aggregated over a fixed period (error rate, CPU usage, request count, and so on) | Is the whole system healthy, and since when has it been bad | Volume does not grow with traffic; it grows with the number of series |
| Traces | The path one request took through multiple services | Which operation in which service was slow | Expensive because of the detail |
Logs
As the OpenTelemetry primer points out, logs are not necessarily tied to a particular request and often lack context about where they were called from. Linking them with trace information, described later, greatly widens what you can do with them.
Metrics
Metrics are data aggregated into numbers. The CNCF whitepaper says metric volume does not grow as traffic grows, so processing cost is easy to predict. In exchange, you cannot see values between aggregations or anything finer than the unit you aggregated by (which process used the memory, for example).
What drives metric cost is the number of series created by label combinations (cardinality). In the whitepaper’s example, 100 data centers with 10,000 hosts each produce 1,000,000 series from a single metric. If you put labels with many distinct values, such as user IDs or request IDs, the series multiply by the number of those values.
Traces
A trace records the path one request took. The path is a set of spans, each representing one unit of work. The first span (the root span) covers the request from start to finish, and child spans hang below it. For a request that passes through an API gateway, a backend, and a database, each becomes a span.
Many backends display traces as a waterfall chart like the one below. The horizontal axis is time, the long bar at the top is the root span, and the indented bars below it are child spans. Bar lengths show which operations took most of the total time.
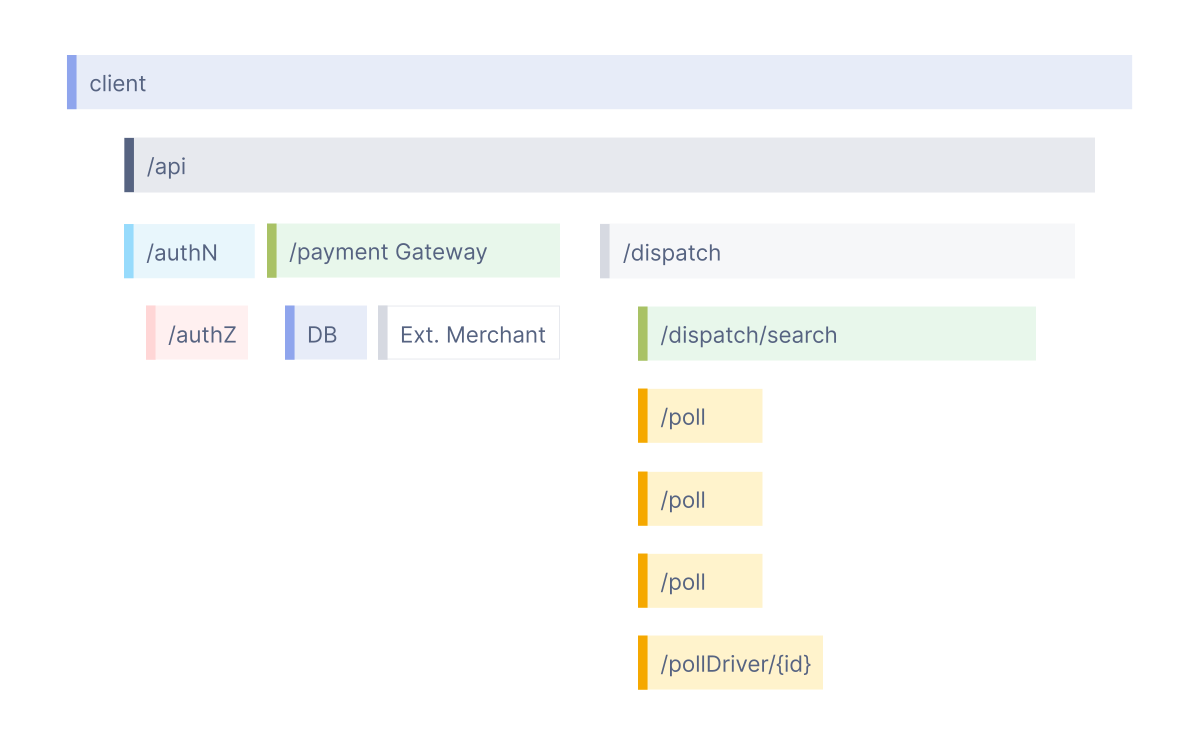
The CNCF whitepaper treats traces as a detailed, expensive signal. OpenTelemetry calls sampling, which keeps only some requests instead of recording all of them, one of the most effective ways to reduce observability costs without losing visibility.
Decide what to measure from the four golden signals
Trying to collect everything increases both cost and the number of dashboards. The SRE book recommends that if you can only measure four metrics of a user-facing system, you measure these four:
- Latency: the time it takes to serve a request. Measure successes and failures separately
- Traffic: the demand placed on the system. For a web service, HTTP requests per second
- Errors: the rate of requests that fail
- Saturation: how full resources such as CPU and memory are
Latency is split by success and failure because an HTTP 500 triggered by a lost database connection may come back very quickly, and mixing it into overall latency can mislead the calculation. The SRE book says a slow error is even worse than a fast error and advises tracking error latency too.
The “RED metrics” in Grafana Labs’ announcement are the indicators of the RED method devised by Tom Wilkie: requests per second (Rate), the number of failing requests (Errors), and the time requests take (Duration). The idea appears close to the golden signals.
A trace ID links the three
Even when you notice the error rate rising on a dashboard, metrics alone cannot identify the requests that caused it. Searching logs, you find logs from the same request scattered across services. This is where the trace ID comes in: it is attached to both the logs and the spans of the same request.
A trace ID is an identifier assigned to one request and carried over to the services it calls. For HTTP, the W3C Trace Context standardizes the handoff as the traceparent header. Its value joins four fields with -: version, trace ID, parent span ID, and flags. The example in the spec is:
traceparent: 00-0af7651916cd43dd8448eb211c80319c-b7ad6b7169203331-01For logs, OpenTelemetry’s log data model also has TraceId and SpanId fields. If you write the trace ID into your logs, you can go from a slow trace to only the logs emitted by that request.
Checking it on my own machine
With OpenTelemetry’s Python SDK, I reproduced, inside one process, a checkout screen (GET /checkout) calling an inventory service. The caller writes the context into headers, the callee extracts it and creates a child span, and the log gets the trace ID.
import logging, time
from opentelemetry import trace
from opentelemetry.sdk.trace import TracerProvider
from opentelemetry.sdk.trace.export import SimpleSpanProcessor, SpanExporter, SpanExportResult
from opentelemetry.propagate import inject, extract

class Short(SpanExporter):  # exporter that just prints each span on one line
    def export(self, spans):
        for s in spans:
            c = s.context
            p = s.parent.span_id if s.parent else None
            print(f"span name={s.name} trace_id={c.trace_id:032x} span_id={c.span_id:016x} "
                  f"parent={'-' if p is None else format(p,'016x')} ms={(s.end_time-s.start_time)/1e6:.0f}")
        return SpanExportResult.SUCCESS

trace.set_tracer_provider(TracerProvider())
trace.get_tracer_provider().add_span_processor(SimpleSpanProcessor(Short()))
tracer = trace.get_tracer("demo")

class TraceIdFilter(logging.Filter):  # attach the current trace ID to log records
    def filter(self, r):
        c = trace.get_current_span().get_span_context()
        r.trace_id = format(c.trace_id, "032x") if c.is_valid else "-"
        return True
logging.basicConfig(format="log level=%(levelname)s trace_id=%(trace_id)s msg=%(message)s", level=logging.INFO)
log = logging.getLogger("inventory"); log.addFilter(TraceIdFilter())

def inventory_service(headers):
    ctx = extract(headers)  # extract the parent context from the received headers
    with tracer.start_as_current_span("SELECT stock", context=ctx):
        time.sleep(0.12)
        log.warning("stock query slow")

with tracer.start_as_current_span("GET /checkout"):
    headers = {}
    inject(headers)  # write the context into the headers sent to the callee
    print("header", headers)
    inventory_service(headers)
In the environment I tested (Python 3.11.18, opentelemetry-sdk 1.45.2, November 3), it printed the following.
header {'traceparent': '00-290ed4a2cd11fb6a3be0b7f189042cd8-64741dabcbd1295f-03'}
log level=WARNING trace_id=290ed4a2cd11fb6a3be0b7f189042cd8 msg=stock query slow
span name=SELECT stock trace_id=290ed4a2cd11fb6a3be0b7f189042cd8 span_id=3f104be7d80f9123 parent=64741dabcbd1295f ms=120
span name=GET /checkout trace_id=290ed4a2cd11fb6a3be0b7f189042cd8 span_id=64741dabcbd1295f parent=- ms=121
Three things stand out.
- The second field of the header (
290ed4…) matches the trace ID of the log and both spans. This value lets you go from logs to traces and from traces to logs - The third field of the header is the ID of the caller’s span (
GET /checkout), and it appears asparenton the inventory span. This forms the parent-child relationship in the waterfall chart - The trailing flags were
03. The Trace Context Recommendation (Level 1) defines only the lowest bit (01), which marks the trace as sampled. The second bit, added by the Level 2 draft, indicates that the trace ID was generated randomly
Here I only printed the spans to the screen. In practice you send them through something like the OpenTelemetry Collector to a backend such as Jaeger or Grafana and display them as a waterfall chart.
The biggest effort is instrumentation
The mechanism is simple, but adding this instrumentation to every service is hard work. Grafana Labs’ announcement also says instrumenting a meaningful part of a system can take “months of manual work,” and calls instrumentation the biggest bottleneck when starting with observability.
With Instrumentation Hub, a single Helm command installs Alloy (Grafana’s distribution of the OpenTelemetry Collector) in a Kubernetes cluster. Everything running in the cluster is then listed by namespace and technology, showing which parts are instrumented. From there, Grafana says you can add OpenTelemetry’s auto-instrumentation SDKs to the services you choose without restarting Pods. It targets Linux Kubernetes clusters connected to a Grafana Cloud stack.
The announcement also lays out an order for adoption: first make the infrastructure (the machines your code runs on) visible, then get an overview of the whole system with RED metrics and service-to-service relationships, and only then move on to distributed tracing.
To start small, it seems fine to begin by collecting the four golden signals as metrics and attaching trace IDs to logs. Tracing in every service can come later; even before that, the trace IDs in your logs let you go from a symptom to the request that caused it.
Verification
- Last verified
- Environment
- Python 3.11.18
- opentelemetry-sdk 1.45.2
Related notes
AI
Claude Code on Google Cloud: org spend limits and ROI
Using Claude Code via Google Cloud Agent Platform in an organization: budgets and limits, collecting usage, and measuring impact, checked against Anthropic's article and the docs.
9 min
Infrastructure
Toride City drops VDI: pooled PCs, upgrade costs, operations
Keeping VDI would have made the server renewal cost over 4x the last one, so Toride City moved 350 LGWAN desktops to a Remote PC Array. What changed, and what it takes on.
7 min